
The Average Stock Market Return
When financial advice articles mention the average stock market return, they quote numbers in a wide range, usually between 5% and 12%. That’s a very significant difference: For example, an investment doubles every 6 years with a constant 12% return, but only every 14 years with a 5% return.
What is the actual historical average return of stock market investments?
Stock Prices and the S&P Index
This is the value of the stock market over the last 150 years (monthly price averages, plotted using a logarithmic scale, click on charts to magnify), represented by major stock indexes:
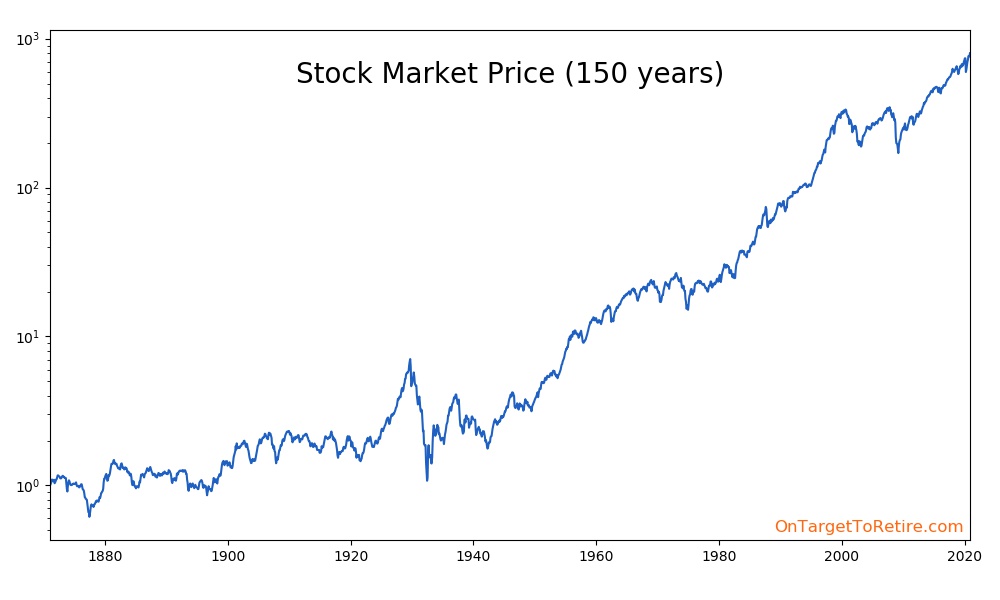
The graph is based on the S&P 500 Index that tracks the stocks of 500 large companies listed in the US since 1957 and is often used to represent typical US stock market returns. Other similar indexes are used for the years before 1957.
The prices have been scaled to start at $1. This way, the blue line represents the value of a $1 initial investment over time.
Total Return
Judging by the chart, it may look like before World War II the stock market was anemic compared to today. That’s mainly because, in the past, companies used to return a bigger slice of their value to investors in the form of dividends, which are not reflected in stock prices. Over time, the amount of dividends has decreased and companies have used other methods like stock buybacks to increase their stock prices.
Since someone investing in a mix of S&P companies would benefit from both price gains and dividend gains, it makes sense to add them together. Dividends can also be reinvested in the same stocks to further compound the gains. The resulting overall gain is called the ‘total return’:
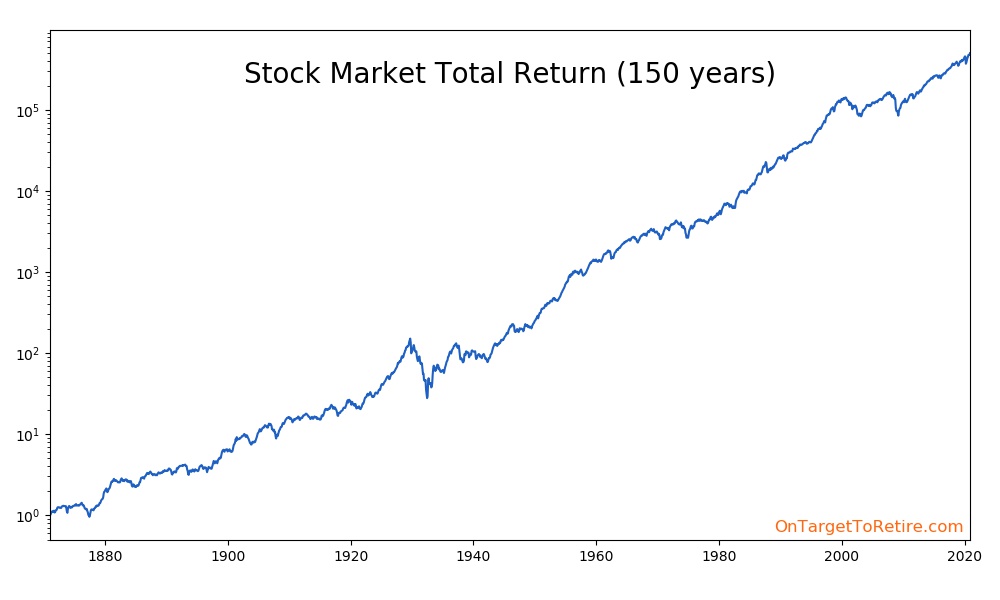
The total return looks much more consistent and our investment increases through time almost at a steady pace, despite a few bumps like the Great Depression. Reinvesting the dividends also greatly improves our results (note the different vertical scale in the graph).

If we add a trend line to the total return (the line represents an average yearly return of 9.4%), we still see that there was a small change in pace after the Great Depression.
Since a lot has changed over time in the stock market and the world, let’s limit our focus to the last 100 years (from the start of 1921 to the end of 2020):
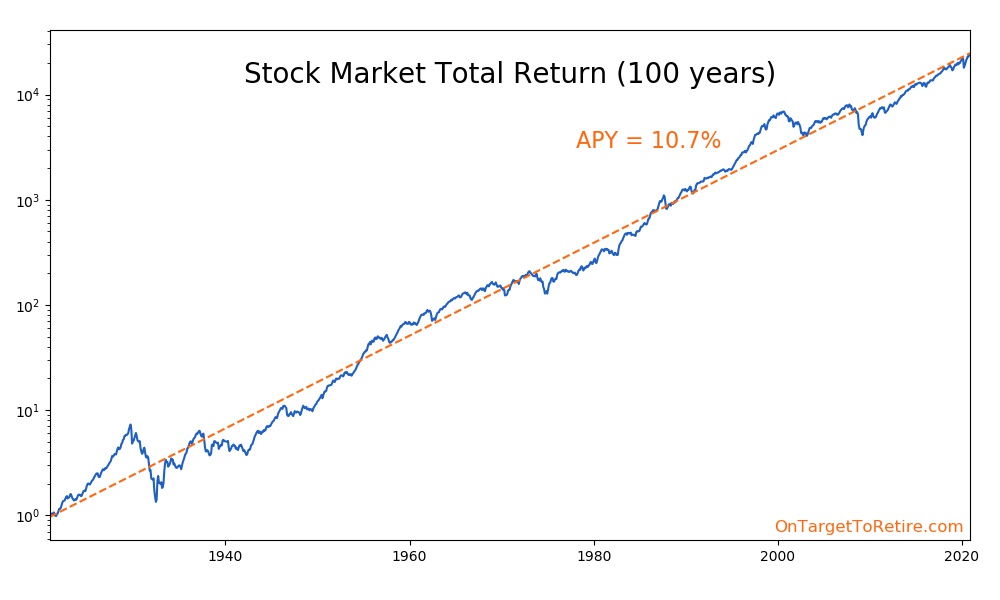
It is reassuring to see that, despite some recessions, the growth of the market has been remarkably consistent!
The slope of the trend line (computed by using the linear regression formula) provides the answer to our original question: as of 2021, the average total return of the stock market over the previous 100 years has been 10.7% per year!
Real Return
By using the 10.7% APY value, we can determine for example that on average the value of an investment in an index fund tracking the S&P 500 would double in about 7 years (math: (1 + 10.7/100)7 = 2.03).
Cue in the gremlins of inflation!

Continuing the same example, an investment of $1000 would grow to about $2000 in 7 years. Assuming an inflation rate of 3%, in 7 years, those $2000 dollars will only be able to buy $1626 worth of goods in terms of today’s dollars (because what costs $1626 today will cost $2000 in 7 years due to rising prices).
Rather than separately keeping track of market returns and inflation, we can apply the historical values of inflation to the total return data, getting what is called the ‘real’ total return:
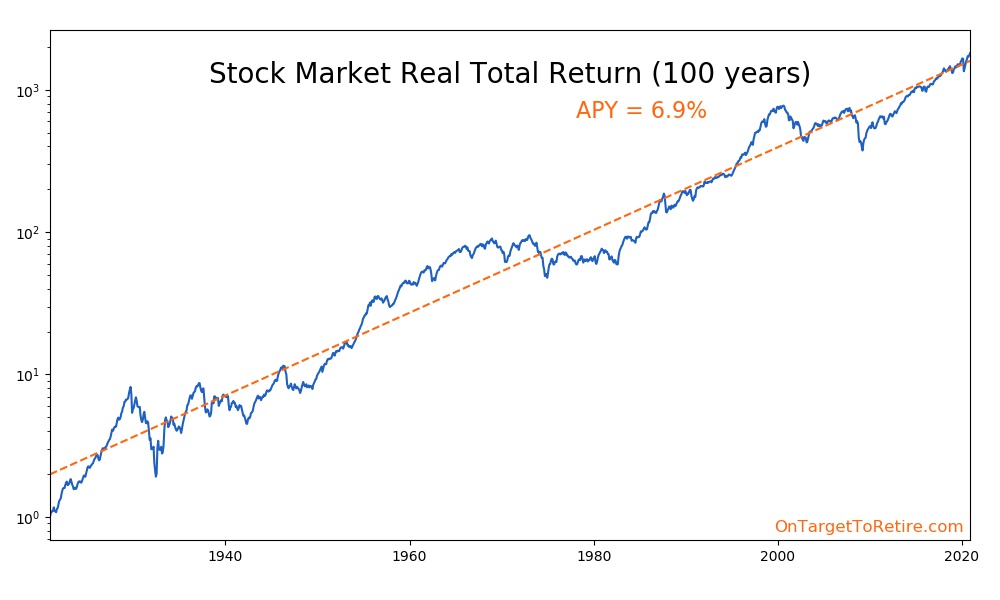
Inflation has scared the market return graph into a shaky, more irregular line compared to the previous chart. For example, the market return across the 70s already looked paltry in the previous chart, but in this one it becomes negative (the high inflation surpassed the market return).
Computing the linear regression again, we find that the average real total market return has been 6.9% per year over the last 100 years.
We can use this rate to directly compute average gains in terms of today’s dollars. For example, if I invest $1000 for 10 years, on average at the end I will be able to use my investment to buy something that costs $1949 today (math: 1000 * (1 + 6.9/100)10 = 1949).
Rule of 72
As an aside, there is a simple formula to estimate how long it takes for an investment to double: divide 72 by the rate of return. Taking the last example of a 6.9% rate of return: 72 / 6.9 = 10.4 years.
It’s an approximate formula, but it works reasonably well for stock investments.
A Word of Caution
Of course, the value of the average market return would slightly vary if we used different date ranges, and there is no way to predict how it will change in the future.
Limiting our analysis to the past, here is the last chart again, with the official US recession periods added as grey bars. I have highlighted in red three of the worst eras for stock investors:
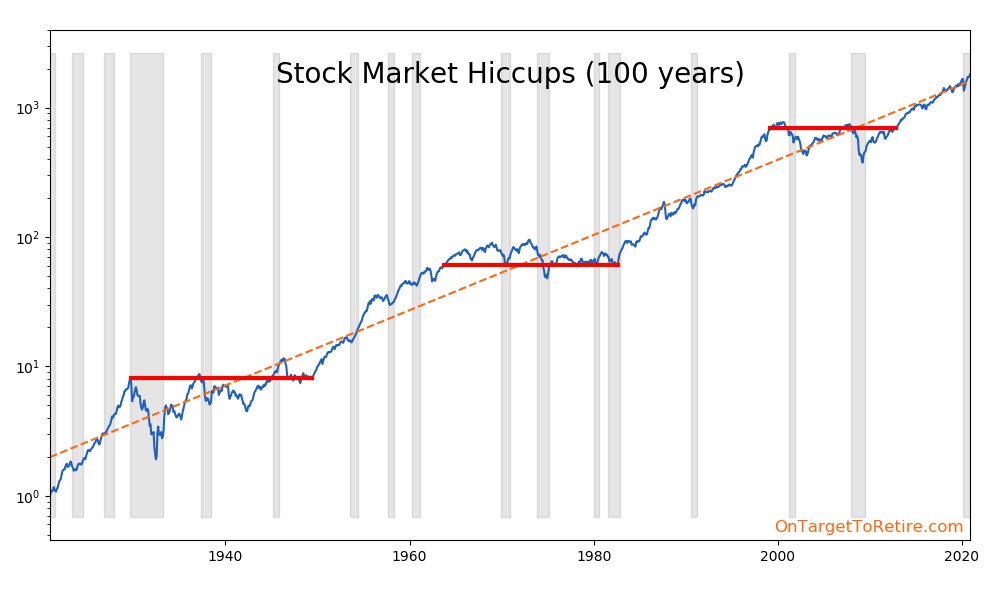
These are not the absolute worst entry and exit times (those tend to correspond to market crashes and would have negative returns), but the longest stretches of time I could find where the market return exactly matched inflation, for a net average real return of 0%.
The duration of the red lines varies between 14 and 20 years and if we add them together we get a total duration of 52 years… that’s half of the 100 years we are considering!
Don’t panic! This is a worst-case scenario handpicked in hindsight. There was a bull market before and after each period: Many long-term investors would have recovered, especially when considering that people contribute or deplete their investments little by little over most of their lives, not all at once.
Still, this graph should give us some thought: Long market hiccups do happen and using the ‘average market return’ figures can only provide us with the average outcome. The actual outcome can differ significantly from the average, especially when considering time horizons of less than 30 years.
Conclusions
Over the last 100 years, the average total return of the US stock market (approximated by indexes like the S&P 500) has been 6.9% (or 10.7% before correcting for inflation).
If we believe that the overall market trend will continue in the future, we can use this knowledge to get estimates of how an investment is expected to fare on the average in the future.
However, the market can substantially deviate from the average, even for stretches longer than a decade. Rather than basing our plans on the average return, it would be advisable to consider the entire distribution of market returns (especially for short-term projections) and devise flexible plans that can work in a variety of market conditions.
